On this page
- Key takeaways
- What is a social media reporting tool (and how is it different from analytics)?
- How do you choose a social media reporting tool? Eight criteria that matter
- What are the 12 best social media reporting tools?
- What's the fastest way for an agency to send monthly client reports?
- How should a multi-location brand report on social media?
- What should a social media report include? KPIs and a monthly template
- How do you build and automate a social media report, step by step?
- What are the most common social media reporting mistakes?
- Report on every account from one place with Sked Social
A social media reporting tool pulls performance data from every social account you run, plus ads and website traffic, into scheduled reports you can share. Our picks: Sked Social for agency client reports and multi-location roll-ups, Sprout Social or Hootsuite for large in-house teams, Agorapulse for inbox-heavy teams, and Meta Business Suite if free native data is enough.
Key takeaways
- Analytics is for the person doing the work. Reporting is for the person paying for it: a client, head office, or leadership.
- In a Gartner survey of 378 senior marketing leaders, only 52% said they could prove marketing's value and get credit for it. Reporting is the proof step.
- Pick a tool on eight things: cross-account roll-up, scheduled delivery, export formats, branding depth, data history, paid plus organic plus web traffic, benchmarking, and how the price scales as you add clients.
- Free native analytics covers one network or one business at a time. It cannot roll up clients or locations, or send a branded report on a schedule.
- The fastest way for an agency to report on many clients is one account group per client, one template per client type, and a recurring report on a rolling "last month" range.
- Multi-location brands need two views from the same data: one roll-up for head office and one scheduled report per location, built from a shared template.
- Sked Social's Report Builder sends recurring, branded PDF and Excel reports on rolling date ranges, with an AI-generated summary on top, on the Accelerate and Custom plans.
What is a social media reporting tool (and how is it different from analytics)?
A social media reporting tool collects performance data from each connected social account, combines it into one view, and turns it into a report someone else can read. Good ones also pull in paid social and website traffic, run on a schedule, and export in a format your audience will actually open.
Analytics and reporting overlap, but they serve different people. Analytics is for the person doing the work: which post format is winning this week, when the audience is online, which caption fell flat. Reporting is for the person paying for the work. A client, a head office, or a leadership team doesn't want 40 charts. They want to know what happened, why it matters, and what you're doing next.
What types of social media reporting tools are there?
There are four types: management platforms with built-in reports, reporting-only connector dashboards, listening and benchmarking tools, and free native analytics.
1. Social media management platforms with built-in reports. Scheduling, approvals, inbox, and reporting live in one product, so your report draws on the same data you published from. Sked Social, Sprout Social, Hootsuite, Agorapulse, Sendible, Vista Social, Metricool, and Iconosquare sit here.
2. Reporting-only connector dashboards. Tools like AgencyAnalytics, DashThis, Swydo, and Looker Studio with connectors pull data from many marketing sources into client dashboards. They don't publish posts.
3. Listening and benchmarking tools. These track mentions, sentiment, and competitors more than your own account performance.
4. Free native analytics. Meta Business Suite, Instagram Insights, LinkedIn page analytics, YouTube Studio, and GA4. Accurate, free, and siloed.
Are free social media reporting tools enough?
Native analytics is a fine place to start. The catch is scope. Each tool covers one network, or one business, at a time. None of them can roll up 10 clients or 30 locations into one branded report. Once you're copying numbers from four native dashboards into a slide deck every month, you've outgrown free.
A DIY Looker Studio or Google Sheets dashboard is the middle path. It's flexible, but you own every broken connector and every metric that changes its name.
Which type of reporting tool fits your team?
| If you are... | Look at... |
|---|---|
| A boutique agency with two to 10 clients | A management platform with multi-client reports (Sked Social, SocialPilot, Vista Social) |
| A mid-size agency with 10 to 50 clients | A management platform with recurring client reports, or a connector dashboard if you also report on SEO and PPC |
| A multi-location head office | A platform that groups accounts by location and rolls them up (Sked Social) |
| An in-house brand team | A management platform with reports built for leadership (Sked Social, Sprout Social, Agorapulse) |
| A solo marketer on a budget | Native analytics first, then Buffer, Later, or Metricool when you need one view |
Sked Social sits in the first group: scheduling, approvals, and reporting live in one place, so the report reflects what was actually approved and published.
How do you choose a social media reporting tool? Eight criteria that matter
Most feature lists look the same from a distance. These eight criteria are where reporting tools actually differ, and where the wrong pick costs you hours every month.
1. Cross-account roll-up. Can you combine every account in a client, brand, or location group into one summary, then drill down to a single profile? An agency needs per-client views. A head office needs the whole network plus each location.
2. Scheduled delivery with rolling date ranges. A recurring report should run on "last month" or "last quarter" without you editing dates. Check whether you can set the day, the time, and the recipients, and whether you can preview the next send dates.
3. Export formats and access. PDF, Excel or CSV, slides, or a live link. Then ask the follow-up question: does the reader need a login to see it? Clients rarely want another password.
4. Branding depth. "Branded PDF" and "white-label platform" are different things. A branded PDF carries your logo and colors on the report itself. A full white-label platform puts the whole tool on your own domain or client portal, with no vendor name anywhere. Decide which one your clients expect before you compare prices.
5. Data history and comparison periods. How far back does the data go, and can you compare this month against last month or the same month last year? Native APIs often backfill only a limited window when you first connect an account, so connect early.
6. Paid, organic, and website traffic in one report. Organic reach alone rarely answers "did social work?" Look for paid and boosted post data next to organic, plus GA4 website traffic from social.
7. Competitor benchmarking. Can you add competitors and compare follower growth, posting cadence, and engagement? Check how many competitors each plan allows. Sked Social's competitor monitoring tracks up to five competitors on Grow and 20 on Accelerate.
8. The pricing model, and how it scales. An agency adding three clients a quarter feels each model differently. Per-user pricing rises with headcount. Per-account pricing hurts when a client adds TikTok. Per-plan pricing is predictable until you hit the plan's limits. Sked Social prices per plan: Grow includes three users and Accelerate includes six, with extra users available on Accelerate.
Why this matters: in a Gartner survey of 378 senior marketing leaders conducted in April and May 2024, only 52% said they were successful in proving the value of marketing and receiving credit for helping meet enterprise objectives. Gartner research reported by DestinationCRM in October 2024 also found that 62% of leaders who meet regularly with their top analytics leaders and teams can prove value, against 30% of those who meet infrequently. Reporting is the proof step. If the report is late, inconsistent, or unreadable, the work behind it doesn't get credit.
How did we choose these tools?
We applied the eight criteria above to each tool. Our sources were our own competitor profiles and the vendors' own pricing pages. Where we couldn't confirm a detail, the table says "check vendor" rather than guessing. We don't quote competitor prices, because they change often and differ by billing period and currency.
Sked Social pricing and features checked November 2026. Plan features for Agorapulse, Iconosquare, Metricool, SocialPilot, Sendible, and Vista Social checked on each vendor's pricing page, November 2026.
What are the 12 best social media reporting tools?
The best social media reporting tool depends on who reads the report. Sked Social suits agency client reports and multi-location roll-ups. Sprout Social and Hootsuite suit large in-house teams. Agorapulse suits teams that live in the inbox, and Iconosquare suits Instagram-led brands. Metricool suits teams that want long data history and slide-ready exports. SocialPilot, Sendible, and Vista Social suit small agencies, and Buffer and Later suit solo marketers. Reporting-only dashboards fit agencies that report on every channel.
Here's the short version. Every entry below uses the same template: best for, key reporting features, limitations, and pricing model.
| Tool | Best for | Scheduled reports | Branding depth | Competitor benchmarking | Exports | Pricing model |
|---|---|---|---|---|---|---|
| Sked Social | Agencies and multi-location brands | Yes, recurring on rolling ranges (Accelerate, Custom) | Branded PDF; no white-label domain | Yes (five competitors on Grow, 20 on Accelerate) | PDF, Excel (Accelerate, Custom) | Per plan, from US$69/mo (Grow) |
| Sprout Social | Large in-house teams | Check vendor | Check vendor | Check vendor | Check vendor | Check vendor |
| Hootsuite | Large teams on many networks | Check vendor | Check vendor | Check vendor | Check vendor | Check vendor |
| Agorapulse | In-house teams and agencies | Check vendor | Check vendor | Check vendor | Check vendor | Per user |
| Iconosquare | Instagram-led brands | Check vendor | White-label on Custom plan | Check vendor | PDF, XLS | Check vendor |
| Metricool | Teams that want long data history | Check vendor | Check vendor | Check vendor | PDF, PPT from Starter; Looker Studio on higher plans | Check vendor |
| SocialPilot | Small agencies | Check vendor | White-label PDF on upper tiers | Check vendor | Per plan, with social account caps | |
| Sendible | Agencies that want white-label | Check vendor | White label as a paid add-on on top plans | Check vendor | Check vendor | Check vendor |
| Vista Social | Agencies that want scheduled reports | Custom reports on a schedule from Advanced | Check vendor | Check vendor | Check vendor | Check vendor |
| Buffer | Solo marketers and small teams | Check vendor | Check vendor | Check vendor | Check vendor | Check vendor |
| Later | Instagram and TikTok-first brands | Check vendor | Check vendor | Check vendor | Check vendor | Check vendor |
| Reporting-only dashboards | Agencies reporting on many channels | Check vendor | Check vendor | Check vendor | Check vendor | Check vendor |
1. Sked Social: Best for agencies and multi-location brands
Best for: agencies reporting to many clients, and head offices reporting across many locations.
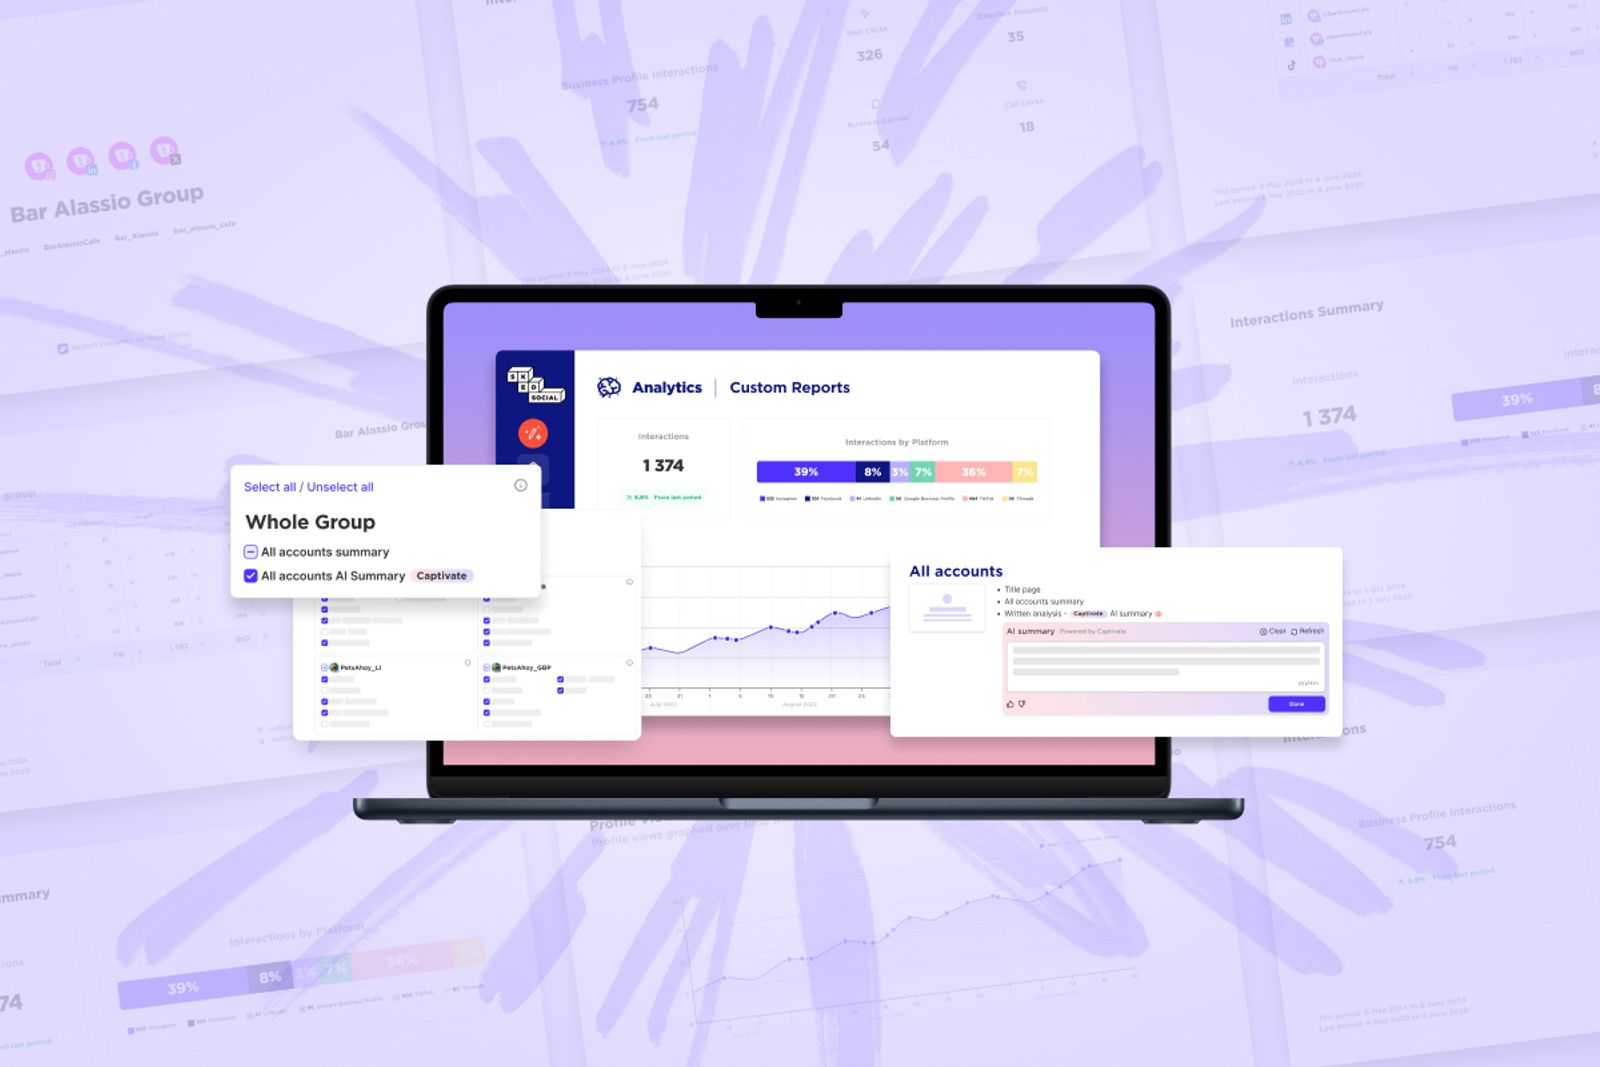
Key reporting features: Sked Social's analytics start with Brand Summary, one view across every account in a group. The Report Builder adds AI-generated summaries, templates, and one-off or recurring reports on rolling ranges like last week, last month, or last quarter, sent to named recipients as branded PDF or Excel files. Reports can include Labels performance, Meta paid and boosted-post insights, and GA4 website traffic from social. It analyzes Instagram, Facebook, TikTok, LinkedIn, X, Pinterest, YouTube, Google Business Profile, and Threads.
Plan scope: custom reports, comparison periods, and PDF and Excel export are on Accelerate and Custom. Labels analytics is Accelerate and above.
Pricing model: per plan. Grow is US$69/mo and Accelerate is US$249/mo for new sign-ups, billed monthly.
What's included, what isn't
- Included on Accelerate and Custom: the Report Builder, recurring reports with a next-runs preview, comparison periods, PDF and Excel export, and Labels analytics.
- Included on every plan we sell: Brand Summary, core analytics, AI analysis, one-off reports, GA4 website traffic, and weekly and monthly email summaries.
- Grow has no custom report builder, no PDF or Excel export, and no comparison periods. Its Brand Summary looks back 40 days.
- Report Builder reports go out as PDF or Excel files or by scheduled email. They have no web link. For live access, you can share a read-only Insights view that clients open without logging in. It shows Sked Social's interface, not your branding.
- There's no white-label custom domain or client portal. Reports carry your branding, not your URL.
- Snapchat isn't covered by analytics.
2. Sprout Social: Best for large in-house teams
Best for: in-house brand teams at larger companies that want reporting inside a broad social media management platform and have the budget for it.
Key reporting features: cross-network reporting inside the same platform you publish from, suited to teams who report upward to leadership on a regular cadence. Check the vendor's current plans for which reports and export formats sit on each tier.
Limitations: it's built for enterprise teams, so smaller agencies can find it more platform than they need. Check how its pricing scales as you add team members before you commit.
Pricing model: check vendor.
Compare the two side by side in our Sprout Social vs Sked Social comparison.
3. Hootsuite: Best for large teams on many networks
Best for: larger teams that want one long-established platform across many networks and are comfortable with a bigger learning curve.
Key reporting features: cross-network analytics and reports inside the same tool you publish from. Check the current plan pages for which report types, scheduled sends, and exports each tier includes.
Limitations: smaller teams can end up paying for depth they don't use. Confirm which reporting features sit on the plan you're pricing, not the top tier.
Pricing model: check vendor.
See how the two compare in our Hootsuite vs Sked Social comparison.
4. Agorapulse: Best for in-house teams and agencies that live in the inbox
Best for: teams where community management and reporting carry equal weight.
Key reporting features: reporting across connected profiles alongside its social inbox, so engagement and response data sit next to performance data. Check the vendor's plan page for which report formats and scheduled sends each plan includes.
Limitations: Agorapulse bills per user (checked on its pricing page, November 2026), so price it on next year's headcount, not this year's.
Pricing model: per user.
Read the full Agorapulse vs Sked Social comparison.
5. Iconosquare: Best for Instagram-led brands
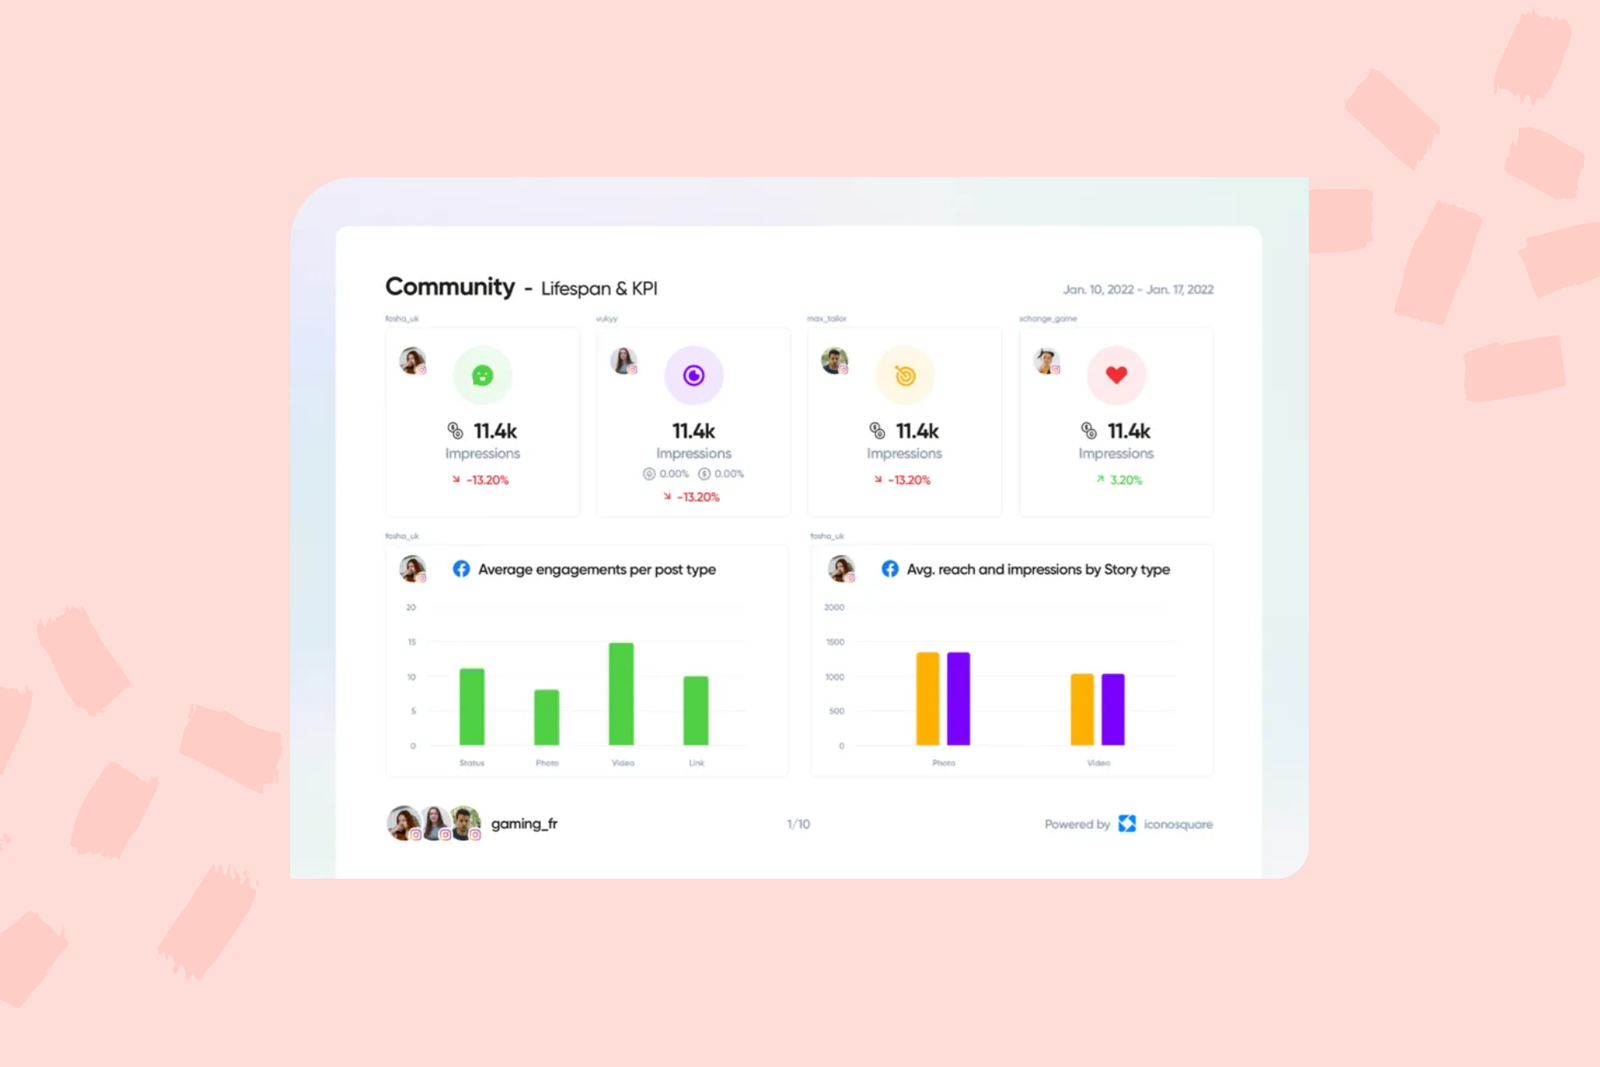
Best for: brands and marketers who live in Instagram and want detailed post-level and account-level analytics.
Key reporting features: report exports in PDF and XLS, automated reports from its Launch plan, and customizable white-label reporting on its Custom plan (checked on its pricing page, November 2026).
Limitations: if white-label reports matter to your clients, budget for the Custom plan rather than an entry tier. Check the vendor for current channel coverage.
Pricing model: check vendor.
See how it stacks up in our Iconosquare vs Sked Social comparison.
6. Metricool: Best for teams that want long data history
Best for: small teams and freelancers who want analytics with deep history and slide-ready exports.
Key reporting features: PDF and PPT report export and full analytics history from its Starter plan, with a Looker Studio connector on its Advanced plan and above (checked on its pricing page, November 2026). PPT export suits teams that present reports in slides.
Limitations: if you want Looker Studio dashboards for clients, you need a higher plan. Check how its plans count brands and accounts before you price a multi-client setup.
Pricing model: check vendor.
7. SocialPilot: Best for small agencies
Best for: small agencies that want scheduling plus client-ready PDF reports on every plan.
Key reporting features: white-label reports on its Premium and Enterprise plans (checked on its pricing page, November 2026), so client reports can carry the agency's brand rather than the vendor's.
Limitations: SocialPilot's plans cap the number of social accounts, with extra accounts available as an add-on. That's predictable for a fixed client list. It gets more expensive as clients add channels, so price your largest client's full channel mix, not your average one. White-label reports start on Premium, not the entry plan.
Pricing model: tiered plans with social account caps.
8. Sendible: Best for agencies that want white-label reporting
Best for: agencies whose clients expect reports, and sometimes the tool itself, to carry the agency's brand.
Key reporting features: client reporting across connected profiles, with white label available as a paid add-on on its top plans (checked on its pricing page, November 2026).
Limitations: white label is a paid add-on on its top plans, so the plan you actually need may sit well above the entry tier. Check which report templates, scheduled sends, and export formats come with each plan.
Pricing model: check vendor.
If you're weighing Sendible for multi-location work, it's worth comparing how each tool groups locations and rolls them up for head office.
9. Vista Social: Best for agencies that want scheduled reports
Best for: agencies and small teams that want custom reports sent on a schedule.
Key reporting features: custom reports you can save and send on a schedule from its Advanced plan, and white-label dashboards and reports on its Scale plan and above (checked on its pricing page, November 2026).
Limitations: scheduled custom reports start on Advanced and white label on Scale, so price the plan your client reports actually need. Check the vendor for export formats and competitor benchmarking on each plan.
Pricing model: check vendor.
Vista Social is a good example of why criterion 2 matters. Scheduled delivery saves an agency a monthly manual send for every client, so check which plan includes it.
10. Buffer: Best for solo marketers and small teams
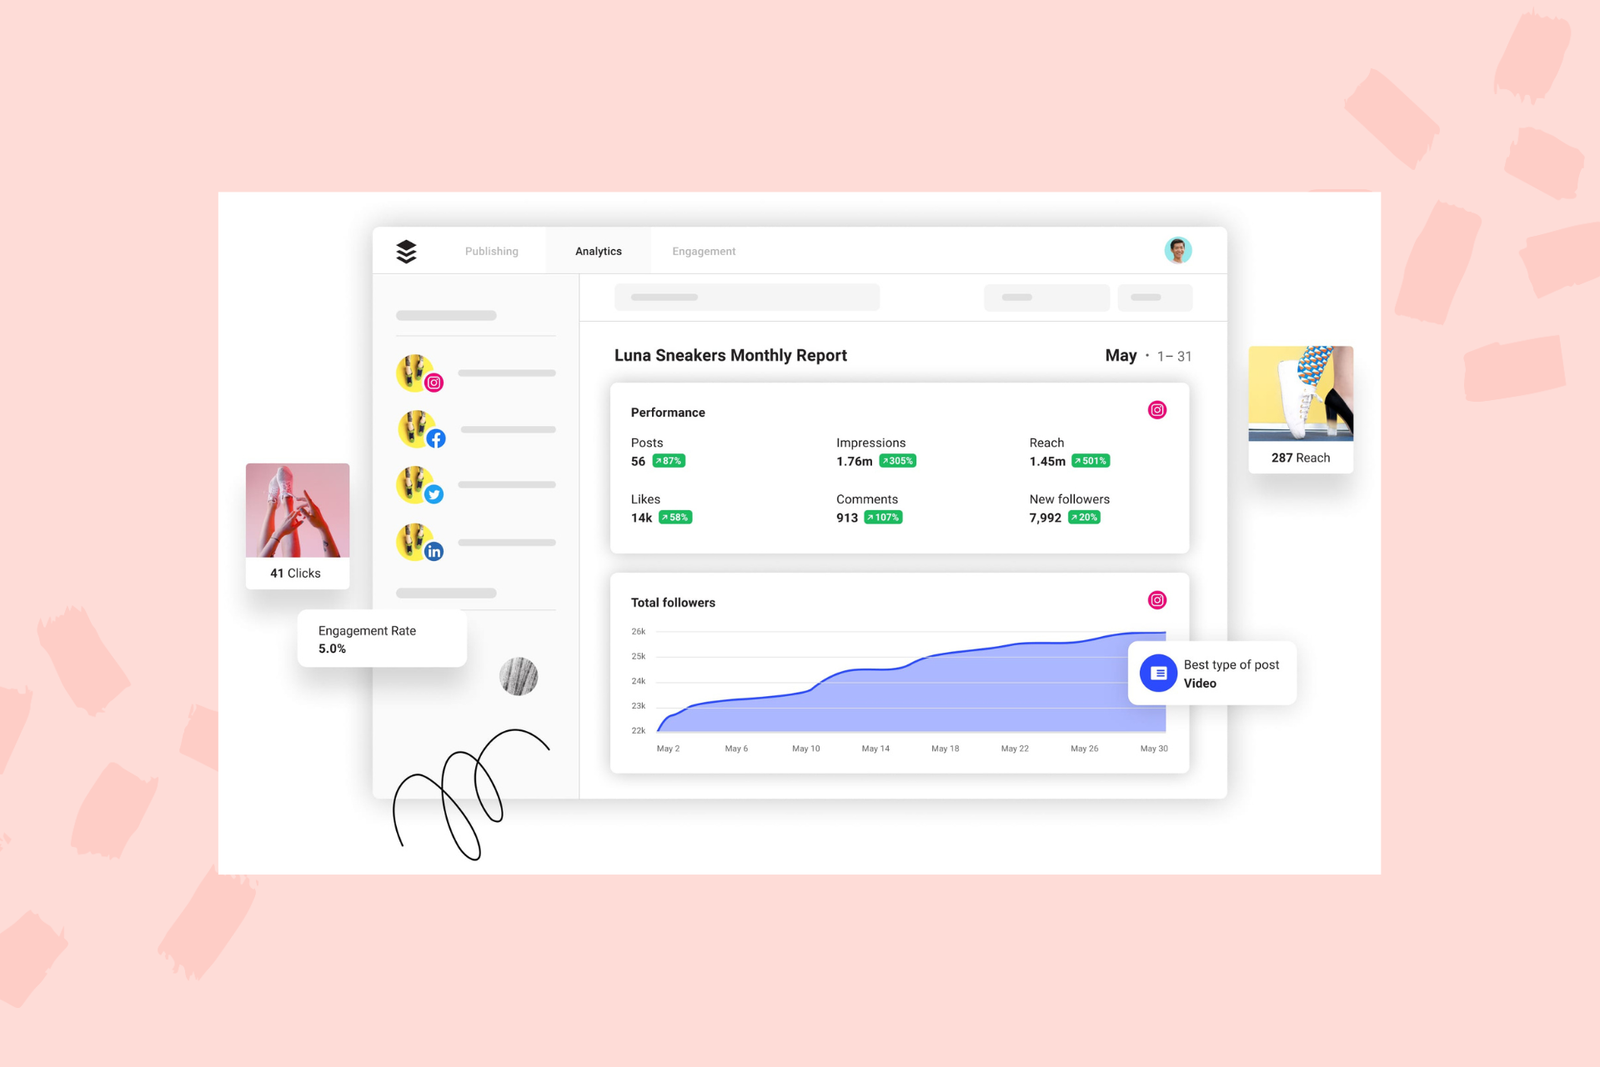
Best for: solo marketers and small teams who mainly need to schedule posts and see how they performed.
Key reporting features: post and account analytics inside a simple scheduler. Check the vendor's current plans for report exports, branding options, and which features need a paid tier.
Limitations: it's built around simplicity, so multi-client roll-ups, approvals, and client-ready recurring reports are where growing teams usually start looking elsewhere.
Pricing model: check vendor.
Compare them directly in our Buffer vs Sked Social comparison.
11. Later: Best for Instagram and TikTok-first brands
Best for: visual brands whose social strategy centers on Instagram and TikTok.
Key reporting features: profile and post performance analytics for the visual platforms, inside a visual planner. Check the vendor's current plans for which analytics, report exports, and history windows each tier includes.
Limitations: if your reporting spans LinkedIn, Google Business Profile, or many client groups, check channel coverage and roll-up options before you commit.
Pricing model: check vendor.
See the full Later vs Sked Social comparison.
12. Reporting-only dashboards (AgencyAnalytics, DashThis, Swydo): Best for agencies reporting on every channel
Best for: agencies that report on SEO, PPC, email, and social for the same client, in one dashboard.
Key reporting features: these tools connect to many marketing data sources and turn them into client dashboards and scheduled reports. They don't schedule or publish posts.
Limitations: you still need a separate tool to plan, approve, and publish social content, so the report and the work live in two places. We don't profile these vendors, so check each one's current channel connectors, branding options, and pricing directly.
Pricing model: check vendor.
The free option: native analytics
Meta Business Suite, Instagram Insights, LinkedIn page analytics, YouTube Studio, and GA4 cost nothing and come straight from the source. As covered in the section on free tools above, they report one network or one business at a time and can't send a branded, rolled-up report on a schedule. To see what changes when you outgrow native data, read our Meta Business Suite vs Sked Social comparison.
What's the fastest way for an agency to send monthly client reports?
The fastest way is to stop building reports by hand. Group each client's accounts, build one template per client type, and set a recurring report on a rolling "last month" range, so every client gets a branded report on the same day. Your monthly time then goes into two or three sentences of commentary per client, not copy-paste.
Agency reporting has a different job from in-house reporting. You're not just measuring performance. You're showing a client, every month, that the retainer is worth it. Consistent reporting is how you show that value, and it gets harder with every client you add.
The fix is a repeatable monthly routine. Here's the one we'd use.
- Group each client's accounts. Put every profile a client owns into one group. In Sked Social, Account Groups do this, so Brand Summary and reports roll up per client without picking accounts each time.
- Build one template per client type. A retail client and a B2B services client care about different numbers. Build a template for each type, not each client, so you maintain three templates instead of 15.
- Set a recurring report on a rolling "last month" range. The report should run itself. Pick the day and time, then check the next-runs preview so you know when it lands.
- Send it to the client's named recipients. Not a shared inbox. The marketing manager who signs off your invoice should get it directly.
- Add two or three sentences of human commentary on top of the AI summary. The AI summary covers what happened. You add why it happened and what it means for this client's goals.
- Close with next month's plan. Every report should end with what you'll do next. That's the line clients remember.
Lead with the executive summary and put the detail second. Write the first page so it stands on its own: the result, the reason, and the next step.
There's also a quieter benefit when approvals, publishing, and reporting live in one place. The client who approved the posts sees how those same posts performed. That closes the loop, and it makes next month's approvals faster. In Sked Social, external approvals by no-login link are on Accelerate and above. Report Builder reports go out as files or scheduled emails, and for live access you can share a read-only Insights view that clients open without logging in. It shows Sked Social's interface, not your branding.
Do agencies need white-label reports?
It depends on what your clients expect. Most clients are happy with a report that carries your logo and colors. Fewer need the whole tool on your own domain. Sked Social sends branded PDF and Excel reports but has no white-label domain or client portal. If a full white-label platform is a must, Sendible offers white label as a paid add-on on its top plans, SocialPilot includes white-label reports from its Premium plan, and Iconosquare offers white-label reporting on its Custom plan (checked on each vendor's pricing page, November 2026).
A hypothetical example
Picture a boutique agency with eight clients and two social media managers.
Before: at the end of each month, both managers log in to every network for every client, screenshot the numbers, paste them into a slide template, and write a summary from scratch. The first week of the month disappears into reporting, and two clients always get theirs late.
After: each client has an Account Group and a recurring report set to "last month", built from one of three templates. On the 1st of each month, the reports generate with an AI summary. The managers spend their time adding commentary and next month's plan, then send. Every client gets the same structure on the same day.
For more on what clients actually want to see, read our guide to social media reports for clients, compare platforms in our roundup of the best social media management tools for agencies, or see how Sked Social works for agencies.
How should a multi-location brand report on social media?
A multi-location brand should report from one tool that groups accounts by location or region, rolls the whole network into one summary for head office, and sends each location its own scheduled report from a shared template, with Google Business Profile reported next to social.
Multi-location reporting has two audiences with opposite needs. Head office wants one view of the whole network: which regions are growing, which locations are quiet, and whether the national campaign landed everywhere. Each location manager wants their own numbers, without wading through 40 other stores.
A reporting tool for multi-location brands has to serve both from the same data. Here's what to look for.
Groups that match how the business is organized. Group accounts by location, region, or brand. A restaurant group might have one group per venue and one per state. A retail brand might group by region. The structure should mirror how head office already thinks about the network, so reports make sense without explanation.
A roll-up for the whole network. Head office needs one summary across every account in a group, with the option to drill down. In Sked Social, Brand Summary gives that aggregate view of followers, engagement rate, reach, and impressions across every account in a group, plus post performance rankings.
Per-location reports on a schedule. Each location gets its own recurring report, built from one shared template, so every store sees the same metrics laid out the same way. Consistency matters here. If each location gets a different format, nobody can compare.
Google Business Profile alongside social. For local brands, Google Business Profile is often where customers find opening hours and directions. Reporting on it next to Instagram and Facebook gives head office the full local picture. Sked Social includes Google Business Profile in its analytics.
Labels for campaigns and content pillars. Tag posts by campaign or content pillar, then report on how each performed across the network. That answers questions like "did the national promotion do better than local posts?" Sked Social's Labels can be created on every plan, and Labels analytics is on Accelerate and above.
Website traffic from social. For a head office, the useful question is often "did social send people to the store locator or the booking page?" Sked Social's GA4 Website Traffic module shows which platforms and posts drive website visits, once a GA4 property is connected and assigned to the group.
The common mistake is building location reporting as an afterthought, after the calendar and approvals are set up. Plan the groups first. Everything else, from the calendar to the reports, hangs off them.
See how Sked Social handles this for multi-location brands.
What should a social media report include? KPIs and a monthly template
A social media report should answer three questions in order: what happened, why it happened, and what you're doing next. Everything in it should serve one of those three.
Which KPIs are worth reporting?
| KPI | What it tells you | Who cares most |
|---|---|---|
| Reach and impressions | How many people saw the content, and how often | Brand and awareness goals |
| Engagement rate | How much of that audience interacted. Define your formula and keep it fixed | Content and community teams |
| Follower growth (net) | Whether the audience is growing, not just the total | Leadership, clients |
| Link clicks and website sessions from social | Whether social sends people somewhere useful | Anyone with a revenue target |
| Conversions from social traffic | Whether those visits did anything | Clients, CMOs, finance |
| Paid vs organic performance | What the ad spend added on top of organic | Whoever approves the budget |
| Top and bottom posts | What to repeat and what to drop | The team doing the work |
| Content pillar or campaign performance | Which themes earn their place in the calendar | Strategy owners |
| Response time (if you run an inbox) | How fast the brand answers people | Customer care, head office |
Engagement rate deserves a warning. Tools calculate it differently: by reach, by impressions, by followers, or by views. Pick one definition, write it in the report, and don't change it mid-year.
What does a monthly social media report template look like?
- Executive summary. Three to five sentences. The headline result, the main reason, and the one thing that changes next month.
- Goals vs results. The KPIs you agreed at the start of the quarter, with this month against last month or the same month last year.
- Channel breakdown. One short section per network, with the two or three numbers that matter there.
- Top and bottom content. Three posts that worked and one that didn't, with a sentence on why.
- Paid and boosted performance. What the spend delivered on top of organic.
- Website traffic from social. Sessions, top landing pages, and conversions if you track them.
- Campaign or content pillar performance. How each theme performed against the others.
- Next month's plan. What you'll test, keep, or stop.
Keep it short. If a section doesn't change a decision, cut it. A report that runs to 20 pages isn't more thorough. It's harder to read.
How do you build and automate a social media report, step by step?
To build a social media report, agree the audience and goal, pick five to eight KPIs, connect every account plus your ad account and GA4, group the accounts, build a template, and schedule it on a rolling date range. Then edit the summary and add next month's plan before it sends.
Automating a report isn't about removing the human. It's about removing the copy-paste, so the human time goes into the commentary. Here's how to set one up from scratch.
- Agree the goal and the audience. Before you pick a metric, write down who reads the report and what decision they make with it. A CMO deciding next year's budget needs different numbers from a store manager deciding what to post next week.
- Pick five to eight KPIs. Use the KPI table above as a menu, not a checklist. Every metric should connect to the reader's goal.
- Connect every account and the data sources around them. Connect each social profile, your Meta ad account if you run paid social, and GA4 for website traffic. Connect early, because native APIs only backfill a limited window of history.
- Group the accounts. Group by client, brand, or location, so a report can cover a whole group in one go.
- Build a template. Choose the pages and metrics once. Add the comparison period you'll use every month. In Sked Social, you can start from a pre-built template in the Report Builder and save your own.
- Choose one-off or recurring. A one-off report suits a campaign wrap-up. A recurring report suits monthly client and head office reporting. For recurring, set a rolling range like last month, then the day of the month and the time.
- Add branding and recipients. Add your logo and colors, name the report, and add the people who should receive it.
- Check the next runs. Confirm the upcoming send dates before you save, so the first report doesn't land on a weekend.
- Edit the summary before it goes. Read the AI summary, correct anything that misses context, and add two or three sentences on what it means and what's next.
- Review the template every quarter. Goals change. If a metric no longer drives a decision, swap it out.
In Sked Social, the custom Report Builder, recurring reports, comparison periods, and PDF and Excel export are on Accelerate and Custom. Grow includes core analytics, AI analysis, one-off reports, and weekly and monthly email summaries.
The first setup takes the longest. After that, the report runs itself, and your monthly time goes into the part only you can do: explaining what the numbers mean.
What are the most common social media reporting mistakes?
Most bad reports aren't wrong. They're just unhelpful. These are the mistakes we see most often, and the fix for each.
Reporting vanity metrics on their own. Follower counts and likes look good in a chart but rarely answer the client's real question. Fix: pair every awareness metric with an outcome metric, like link clicks, website sessions, or conversions from social.
Changing the date range every month. One month covers 1 to 30, the next runs 3 to 2. Nobody can compare. Fix: use a rolling range like "last month" and the same comparison period every time.
Using a different engagement rate formula from last quarter. The number jumps, and it looks like progress when it's a calculation change. Fix: define the formula once, state it in the report, and stick with it.
Sending data with no commentary. A PDF full of charts makes the reader do the analysis. Most won't. Fix: lead with a short executive summary, and add two or three sentences of human commentary on top of any AI summary.
Reporting organic only. If you boosted posts or ran ads, an organic-only report undersells the result and hides what the spend did. Fix: put paid and boosted performance next to organic, clearly labeled.
Ignoring website traffic. Social that sends people to a website is doing a different job from social that only collects likes. Fix: connect GA4 and report on sessions and landing pages from social. Automatic UTM tagging makes that attribution far more reliable.
Building a different report for every client. It feels personal, but it makes reporting slow and inconsistent. Fix: build one template per client type, then personalize the commentary, not the structure.
Ending without a next step. A report that only looks back gives the client nothing to approve. Fix: end every report with next month's plan: what you'll test, keep, and stop.
Connecting accounts too late. Many platforms only backfill a limited history when you first connect, so year-over-year comparisons may not be possible for a new account. Fix: connect every account as soon as you onboard a client or location.
Sending reports nobody reads. If a report goes to a shared inbox, it often goes nowhere. Fix: send it to named recipients, and ask the client once a quarter which sections they actually use.
Common questions
Frequently asked questions
What is a social media reporting tool?
A social media reporting tool collects performance data from every connected social account, plus paid social and website traffic in better tools, and turns it into a report someone else can read. The best ones roll up many accounts, run on a schedule, and export branded files.
What are the top reporting tools for social media?
The top social media reporting tools in 2026 are Sked Social, Sprout Social, Hootsuite, Agorapulse, Iconosquare, Metricool, SocialPilot, Sendible, Vista Social, Buffer, and Later, plus reporting-only dashboards like AgencyAnalytics, DashThis, and Swydo. The right pick depends on who reads the report: clients, head office, or leadership.
What are the best social media reporting tools for agencies?
For agencies, the strongest picks combine multi-client roll-ups with recurring, branded reports. Sked Social, Sendible, SocialPilot, and Vista Social are built with agencies in mind. Reporting-only dashboards like AgencyAnalytics, DashThis, and Swydo suit agencies that also report on SEO and PPC.
Which social media reporting tools offer white-label client reports?
Sendible offers white label as a paid add-on on its top plans, SocialPilot includes white-label reports from its Premium plan, and Iconosquare offers white-label reporting on its Custom plan. Sked Social sends branded PDF and Excel reports with your logo and colors on Accelerate and Custom, but it has no white-label domain or client portal.
What's the fastest way to send monthly reports to eight clients?
Put each client's accounts in one group, build one template per client type, and schedule a recurring report on a rolling "last month" range to each client's named recipients. Reports then generate on the same day every month, and you add two or three sentences of commentary before they go.
What is the best social media reporting tool for a multi-location brand?
Choose a tool that groups accounts by location or region, gives head office one roll-up across the network, and sends each location its own scheduled report. Sked Social does this with Account Groups, Brand Summary, and recurring reports, and includes Google Business Profile and GA4 website traffic in its analytics.
Are there free social media reporting tools?
Yes. Meta Business Suite, Instagram Insights, LinkedIn page analytics, YouTube Studio, and GA4 are free. They're accurate, but each covers one network or one business at a time. They can't roll up many clients or locations or send a branded report on a schedule.
How do you do a social media report?
Start with who reads it and what they decide. Pick five to eight KPIs, pull the numbers for a fixed date range, and lay them out as an executive summary, goals vs results, channel breakdown, top and bottom content, paid and website traffic, and next month's plan.
What should a monthly social media report include?
An executive summary, goals vs results, a channel breakdown, top and bottom content, paid and boosted performance, website traffic from social, campaign or content pillar results, and next month's plan. Keep it to the five to eight KPIs that drive a decision.
What are the seven layers of social media analytics?
The seven layers, from Gohar F. Khan's social media analytics framework, are text, networks, actions, hyperlinks, mobile, location, and search engines. Most reporting tools focus on the actions layer (likes, shares, comments, views) plus hyperlinks (link clicks and website traffic), which is what clients and head office usually ask about.
How do I automate social media reports?
Connect every account, plus your ad account and GA4. Group the accounts by client or location, build a template, and set a recurring report on a rolling range like last month. Add branding and recipients, check the next send dates, and edit the summary before it goes.
Can clients view Sked Social reports without logging in?
Yes, through a shared Insights view, but not through a report link. Sked Social's Report Builder reports go out as branded PDF or Excel files, or by scheduled email to the recipients you choose, and have no web link. For live access, you can share a read-only Insights view that clients open without logging in. It shows Sked Social's interface, not your branding. No-login approvals also let clients review and approve posts without an account.
Report on every account from one place with Sked Social
You didn't get into social media to copy numbers from five dashboards into a slide deck. The hard part of reporting isn't the charts. It's pulling every account, every client, and every location into one report that arrives on time and says something useful.
Sked Social is the social media workspace for growing teams, from first idea to final report. Plan the content, get it approved, publish it, and report on it in the same place, so the report reflects what actually went out.
- Brand Summary rolls up every account in a client, brand, or location group.
- The Report Builder sends recurring, branded PDF and Excel reports on rolling date ranges, with an AI-generated summary you can add your own commentary to (Accelerate and Custom).
- Labels analytics shows which campaigns and content pillars earn their place (Accelerate and above).
- Meta paid and boosted-post insights sit next to organic results.
- GA4 Website Traffic shows which platforms and posts send people to your site.
Real humans support you 24 hours a day, five days a week, with a 94% CSAT rating, and more than 10,000 marketers use Sked Social. Plans start at US$69/mo on Grow, and Accelerate, at US$249/mo, is the plan built for agencies and multi-location brands.
Ready to stop building reports by hand? Start your free trial today. No credit card required.